Life expectancy and healthy life expectancy
Life Expectancy
Life expectancy is an over-arching measure of population health; improvements in life expectancy and in the life expectancy gap are ultimate summary measures of improvements to population health and health inequalities.
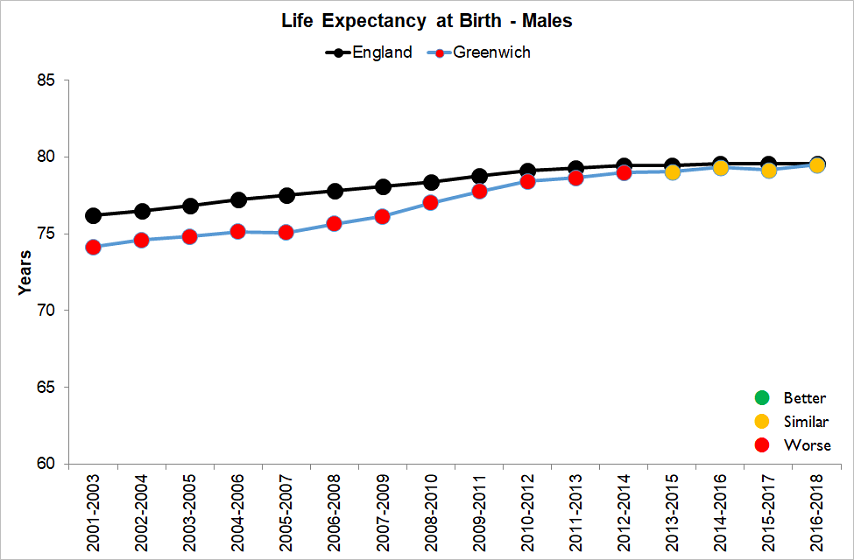
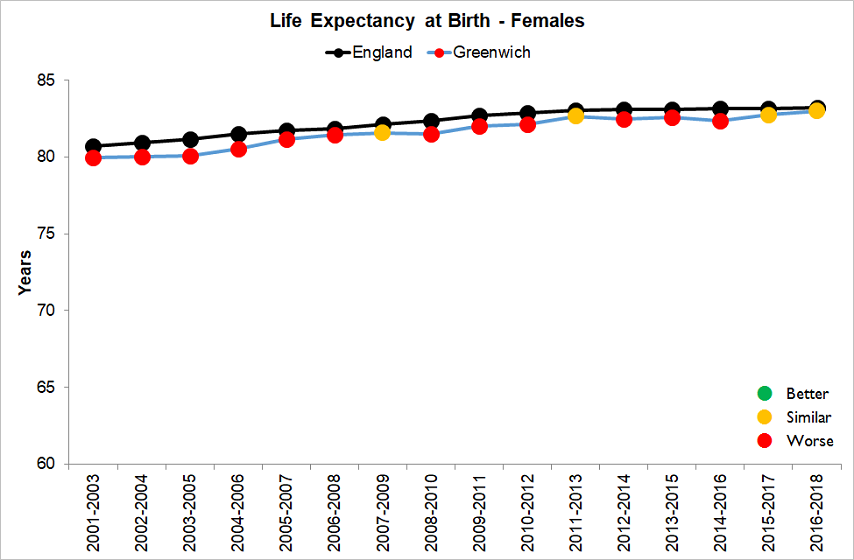
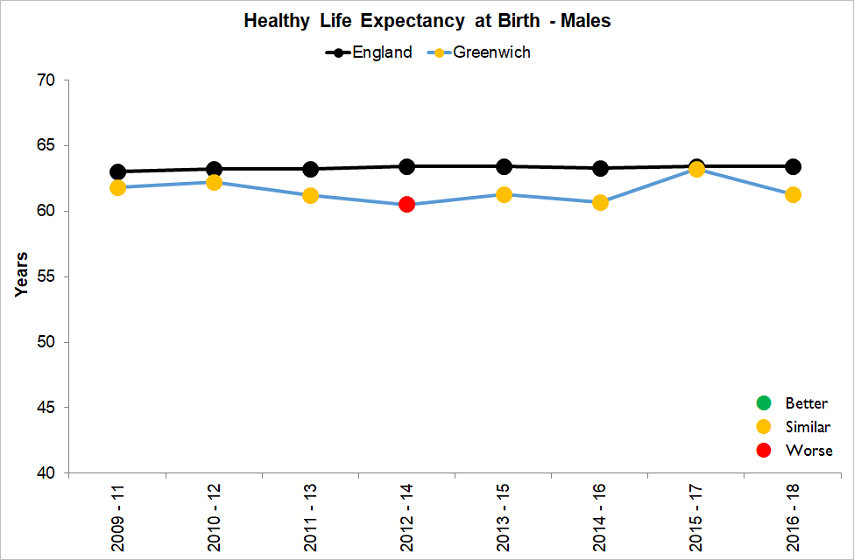
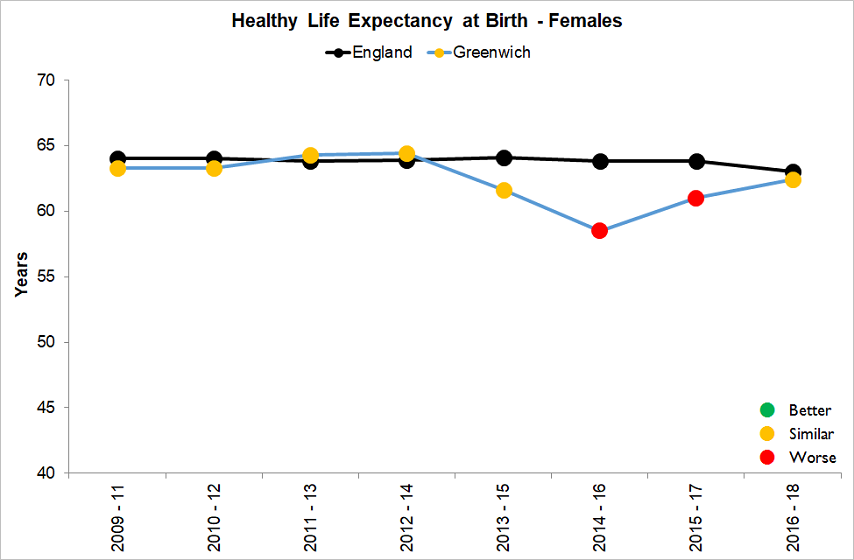
The following charts present the trend data for Greenwich for life expectancy and healthy life expectancy indicators for men and women from the Public Health Outcomes Framework.
Life expectancy at birth has historically followed the England and London trends, but has remained significantly lower than both. Healthy life expectancy at birth for men has been consistent with the England and London trends. However for women, in recent years Healthy life expectancy has been significantly worse than England and London.
Currently male life expectancy at birth within Greenwich is 79.5 years, compared with 79.6 years for England and 80.7 years for London. Male life expectancy has improved at a faster rate and now is similar to the national average. Female life expectancy at birth within Greenwich is 83.0 years, compared with 83.2 years for England and 84.5 for London and has been consistently lower than both.

Source: Public Health Outcomes Framework

Source: Public Health Outcomes Framework
Healthy Life Expectancy
Healthy life expectancy at birth is the average number of years a person would expect to live in good health based on mortality rates and self-reported good health.
As life expectancy increases, the proportion of time spent in good health is increasing in men but decreasing in women.
The latest data for 2015-17 show that at birth in Greenwich, on average women will spend 61.0 years of their life in good health compared to 63.2 years for men. So although women live longer than men, they have more years spent in poor health.

Source: ONS
Trend data for Healthy life expectancy is presented in the chart and suggests that overall between 2009/11 to 2015/17 the proportion of time spent in good health for women decreased, in 2016/18 healthy life expectancy increased slightly and is now similar to England.

Source: Public Health Outcomes Framework

Source: Public Health Outcomes Framework
Health is strongly influenced by our environment, housing, culture and whether we are employed, as well as the food that is available to us, and how easy it is to be physically active in our daily lives.
In order to help improve the life and healthy life expectancy for the people in Greenwich we need to take a partnership approach, across the Council, with partner organisations and with our population.